Resources for Doctoral Students
|
Resources for quantitative analysis
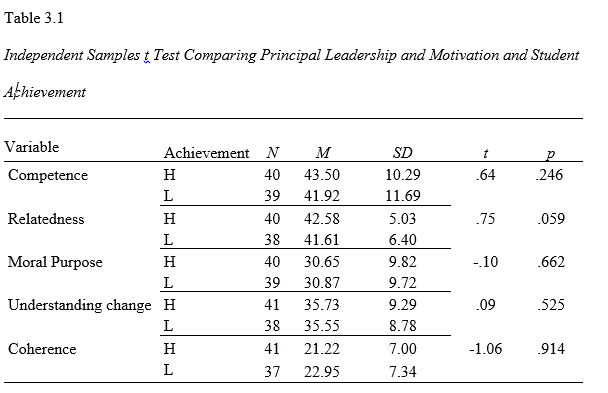
Descriptive Statistics- part 1 Descriptive Statistics -outliers and box plot part 2 How to Change SPPS outputs to have APA style PERMANENTLY (video) Frequency tables (video) Descriptive representation Factor Analysis representation Independent Sample t-test (video) One Way ANOVA (video) Correlation (large and small tables) (video) Two way ANOVA (video) ---- Microsoft Word Help Microsoft Excel Help ---- Concepts Two-way ANOVA Correlation DESCRIPTIVES
|
Descriptive statistics 1 (Means, Median, Skewness, and Kurtosis)
Descriptive Statistics 2 (Outliers and box plots)
Descriptive Statistics 2 (Outliers and box plots)
|
How to change your SPSS outputs to look like APA style PERMANENTLY: (I highly recommended you to watch this video. It will save you a lot of time) (video)
Yes, I italicized all titles in the top of the columns, that's because the statistical symbols are on italics, but the letters should be change to normal |
|
FREQUENCY TABLES - for Item Analysis
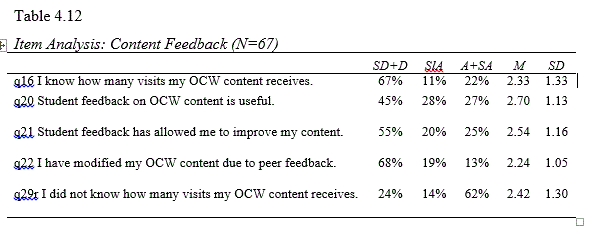
Frequencies Table How to combine several frequencies into one Table-(video) This is an example that has 5 likert scale levels. You will adjust it to your levels SD+ D = Strongly Disagree + Disagree - or Disagreement Level SlA= Slightly Agree A+SA = Agree + Strongly Agree = Agreement Area Click here to see the file closer |
|
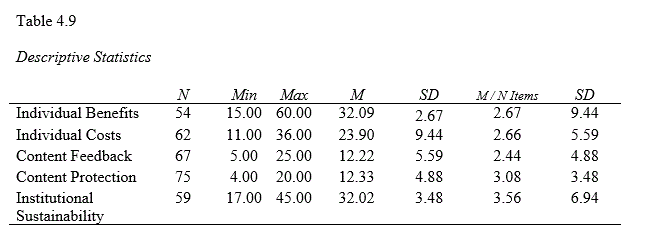
DESCRIPTIVE STATISTICS (video)- variables
The column N/Number of items, has to be done separately in an excel sheet. M /Number of Items per variable |
|
FACTOR ANALYSIS
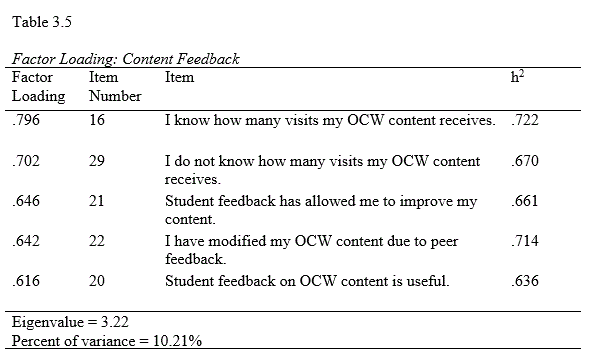
Eigenvalue and percent of variance are coming form the called "Total Variance Explained" Factor Loading column comes from the "communality table" and h square is the representation of the loading in the "Rotated Component Matrix" Click here to watch video example on how to perform factor analysis and where the values on the table come from |
|
Watch the videos of understanding concepts - it includes on how to write the results and how to present the results using APA style
|
|
Your browser does not support viewing this document. Click here to download the document.
|
|
Part 2. Correlation Table formatted to APA style (video)
Special: Correlation - How to Deal with Large Tables (video- and check how to use portrait and landscape orientation in the same document- MICROSOFT WORK SECTION) Now, How can use portrait and landscape orientation in the same document: Use portrait and landscape orientation in the same document
|
Note Microsoft Word automatically inserts section breaks (section break: A mark you insert to show the end of a section. A section break stores the section formatting elements, such as the margins, page orientation, headers and footers, and sequence of page numbers.) before and after the text that has the new page orientation. If your document is already divided into sections, you can click in a section (or select multiple sections), and then change the orientation for only the sections that you select.
| ||||||
Microsoft Word (Page numbering - changing page orientations)
Page numbering (video)
CHANGING LANDSCAPING ORIENTATION IN ONE PAGE
Use portrait and landscape orientation in the same document
MICROSOFT EXCEL - PC AND MAC FOR STATISTICAL ANALYSIS
Using Excel for Statistical Analysis
1. PC
2. Mac
Page numbering (video)
CHANGING LANDSCAPING ORIENTATION IN ONE PAGE
Use portrait and landscape orientation in the same document
- Select the pages or paragraphs that you want to change to portrait or landscape orientation.
- On the Page Layout tab, in the Page Setup group, click Margins.
- Click Custom Margins.
- On the Margins tab, click Portrait or Landscape.
- In the Apply to list, click Selected text..
MICROSOFT EXCEL - PC AND MAC FOR STATISTICAL ANALYSIS
Using Excel for Statistical Analysis
1. PC
2. Mac
Conceptual Understanding Videos
How to identify a research problem
Part 1 - your passion, your goals and your research problem
Part 2. Finding a research topic
Two - Way ANOVA (how to do it in SPSS)
If you want to learn more about TWO WAY ANOVA (how to write the results and which tables present in your research papers) watch this presentation
CORRELATION
If you want to understand the meaning of correlation, watch this presentation (VIDEO)
